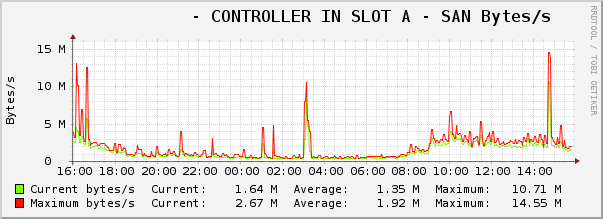
This post is a draft that has sat unfinished since 2013. Some information here may still be useful even though it is incomplete. Since I don’t intend to finish rounding out the Cacti configuration information at any point I thought I would publish it in its current state as someone may find the SAN statistic gathering part useful as it is.
I’ve been using the IBM DS series of SAN hardware for a number of years now and one of the things that always stood out was its lack of SNMP support for performance monitoring. There’s also differences in the GUIs for different model versions, some providing more functionality than others. While the DS3500 series provides short term monitoring capabilities through the IBM DS Storage Manager, the DS3400 series does not. What can we do about this?
Recently I stumbled upon a German blog post that described how to use the SMcli utility which is provided with Storage Manager to get the job done. The method described is a good starting point, but the implementation is lacking. Cacti is capable of a lot but sometimes it can be confusing to figure out how to do it. Using the knowledge gained from that post I’ve put together a more robust solution for monitoring the DS series of SANs with Cacti.
I can confirm that this works with the DS3400 and DS3500 SAN hardware. Since my starting point was from information for the DS4800, I believe it should function with many other models. If your Cacti polling is not set to 5 mins, some changes will be necessary. Any code examples contained within this post were written for a FreeBSD system, and may require some modification to run on another operating system.
Continue reading