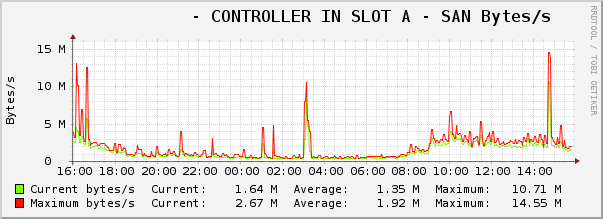
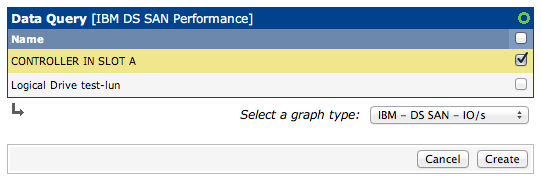
This post is a draft that has sat unfinished since 2013. Some information here may still be useful even though it is incomplete. Since I don’t intend to finish rounding out the Cacti configuration information at any point I thought I would publish it in its current state as someone may find the SAN statistic gathering part useful as it is.
I’ve been using the IBM DS series of SAN hardware for a number of years now and one of the things that always stood out was its lack of SNMP support for performance monitoring. There’s also differences in the GUIs for different model versions, some providing more functionality than others. While the DS3500 series provides short term monitoring capabilities through the IBM DS Storage Manager, the DS3400 series does not. What can we do about this?
Recently I stumbled upon a German blog post that described how to use the SMcli utility which is provided with Storage Manager to get the job done. The method described is a good starting point, but the implementation is lacking. Cacti is capable of a lot but sometimes it can be confusing to figure out how to do it. Using the knowledge gained from that post I’ve put together a more robust solution for monitoring the DS series of SANs with Cacti.
I can confirm that this works with the DS3400 and DS3500 SAN hardware. Since my starting point was from information for the DS4800, I believe it should function with many other models. If your Cacti polling is not set to 5 mins, some changes will be necessary. Any code examples contained within this post were written for a FreeBSD system, and may require some modification to run on another operating system.
Getting Started
Having data for Cacti to graph revolves around scheduling the SMcli utility to gather performance statistics from the SAN. Using SMcli to get this data is straightforward:
|
1 |
./SMcli 10.10.10.2 10.10.10.3 -c "set session performanceMonitorInterval=60 performanceMonitorIterations=5; show allLogicalDrives performanceStats;" |
This command line will talk to the specified controllers, set the monitoring time to 60 seconds, and iterate the performanceStats command 5 times. After five minutes this will output a lot of information that includes lines similar to:
|
1 2 |
"CONTROLLER IN SLOT A","45744.0","51.1","0.8","4637.7","4637.7","762.4","762.4" "Logical Drive test-lun","45697.0","51.1","0.8","4636.1","4636.1","761.6","761.6" |
These lines represent the actual performance data for the storage subsystems on the DS. As we monitor for five iterations, the output will contain five lines for each subsystem. We need to continuously monitor the SAN and have it output a fresh version of these statistics every five minutes to match Cacti’s polling speed. We achieve this with a shell script and cron to schedule it. An example of this is included below.
|
1 2 3 4 5 6 7 8 9 |
#!/usr/local/bin/bash CACHE_PATH="/usr/local/share/cacti/cache" FILE_EXT=`date +%s` INTERVAL="60" ITERATIONS="5" NAME="testds3524" ( /usr/local/ibm-sm-client/usr/bin/SMcli 10.10.10.2 10.10.10.3 -c "set session performanceMonitorInterval=$INTERVAL performanceMonitorIterations=$ITERATIONS; show allLogicalDrives performanceStats;" > ${CACHE_PATH}/ds_$NAME_${FILE_EXT}; mv ${CACHE_PATH}/ds_$NAME_${FILE_EXT} ${CACHE_PATH}/last_ds_$NAME ) & |
The CACHE_PATH is a directory that Cacti has access to where output is written. The filename format is important to maintain so that the followup scripts know what to read. If you have more than one set of controllers to monitor, you can duplicate the last two lines and modify them accordingly. We have to make sure SMcli has finished its run before Cacti tries to read the data, so we schedule it with cron to run one minute before Cacti polls. For example, ds_cache.sh will run at 12:04, finish at 12:09, and Cacti will read the data at 12:10.
|
1 2 |
*/5 * * * * cacti /usr/local/bin/php /usr/local/share/cacti/poller.php > /dev/null 2>&1 4,9,14,19,24,29,34,39,44,49,54,59 * * * * cacti /usr/local/share/cacti/scripts/ds_cache.sh > /dev/null 2>&1 |
Okay, Now What?
Ideally we’re going to want to create individual graphs for each storage subsystem represented in the data output, and doing that in a dynamic way in Cacti is going to involve creating a script (written in whatever language we’re comfortable with) and corresponding script query (written in XML). The Cacti manual is notoriously lacking, but the section on script queries is a sufficient reference to get started understanding the ins and outs.
To keep the post simple, below is a subset of the fields we need to define in our script query. You can see that they have different directions, input and output. Input fields are descriptive and are what we use to identify what we’re creating a graph for (in this case its entryName, which could be “CONTROLLER IN SLOT A” for example), while output fields are data we want to save.
|
1 2 3 4 5 6 7 8 9 10 11 12 13 14 15 16 17 18 19 20 21 22 23 24 |
<interface> <name>IBM DS - Get Entries</name> <script_path>|path_cacti|/scripts/ibm_ds_perf.pl</script_path> <arg_prepend>|host_description|</arg_prepend> <arg_index>index</arg_index> <arg_query>query</arg_query> <arg_get>get</arg_get> <output_delimeter>!</output_delimeter> <index_order>entryName</index_order> <index_order_type>alphabetic</index_order_type> <index_title_format>|chosen_order_field|</index_title_format> <fields> <entryName> <name>Name</name> <direction>input</direction> <query_name>entryName</query_name> </entryName> <totalIOs> <name>Total IOs</name> <direction>output</direction> <query_name>totalIOs</query_name> </totalIOs> </fields> </interface> |
In total we define 10 fields, entryName, totalIOs, readIOs, cachedReadIOs, readPercent, cacheHit, currentKB, maxKB, currentIO and maxIO. It is then up to our script listed in the script_path to decide what it will return for these queries. This allows us to take the raw data we gathered earlier and do calculations to modify that data, or even create new values (which is the case of readIOs and cachedReadIOs). It’s important to note that certain values that get returned from SMcli are different than others. Some count from the beginning of monitoring, while some are for the specific iteration. Information about each value was found in the manual for the SMcli application.
| Field | Calculation |
|---|---|
| totalIOs | Use last value |
| readIOs | totalIOs * (readPercent / 100) |
| cachedReadIOs | totalIOs * (readPercent / 100) * (cacheHit / 100) |
| readPercent | Use last value |
| cacheHit | Use last value |
| currentKB | Sum of all currentKB / total iterations |
| maxKB | Use last value |
| currentIO | Sum of all currentIO / total iterations |
| maxIO | Use last value |
Now with those defined, a script needs to be written that handles the three script query methods: index, query and get. Writing this is a little more in depth than necessary for this post so please refer to the Cacti documentation for an example of a script, or check out the ibm_ds_perf.pl script in the archive for the actual implementation.
With the script finished the initial pieces of the puzzle are complete and it’s possible to set Cacti to the task of creating and updating data sources for your equipment.

