I’ve been mired in IPTV related work for a while now, popping my head up occasionally to grab a breath and take a look at some other neglected things in my day-to-day job. It isn’t long before I’m back into it though, and all the time I’m picking up more knowledge about the world of TV.
One thing that was brought to me recently was some failures related to a network PVR system having trouble ingesting encrypted video content. According to the support team for the software, I-frames in the content were too far apart to ingest properly. The person working on the issue at our company was interested in seeing just how far apart they were, so I set to creating a little script to do just that.
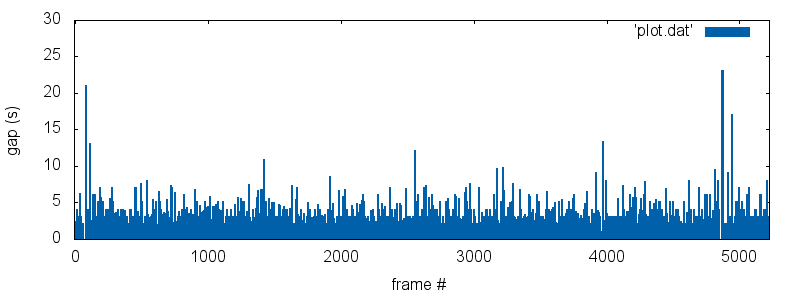
It turned out to be relatively simple using ffprobe, which is part of the ffmpeg suite. Using that data, it’s then possible to plot the I-frame gaps with gnuplot.
I-Frame gaps
The script below will take the video filename as an argument, then output tab delimited data appropriate for use with gnuplot. It looks for I-frames, grabs the relevant fields (pkt_dts_time and coded_picture_number), concatenates and formats them, then does some simple calculations using the time. ffprobe is capable of doing some of the filtering done here, but this was a quick and dirty method.
#!/bin/bash

echo -e "# frame\tdiff"

info=$(ffprobe -show_frames $1 2>&1 | grep -B10 -A1 pict_type=I | grep -e pkt_dts_time -e coded_picture_number | awk '{printf $0;printf " "}NR % 2 ==0 {print " "}' | sed "s/pkt_dts_time=//;s/coded_picture_number=//;")

IFS="
"

first=$(echo "$info" | head -1 | cut -d\  -f1)
lastframetime=0
for i in $(echo "$info"); do
    frametime=$(echo "$i" | cut -d\  -f1)
    frame=$(echo "$i" | cut -d\  -f2)
    frametime=$(echo "$frametime-$first" | bc)
    framediff=$(echo "$frametime-$lastframetime" | bc)
    echo "$frametime $framediff" | tr ' ' '\t'
    lastframetime=$frametime
done
This will create gnuplot compatible data that can then be graphed. For example,
# frame diff
0   0
1.001000    1.001000
1.876867    .875867
2.210533    .333666
3.211533    1.001000
3.545200    .333667
4.045700    .500500
4.379367    .333667
5.380367    1.001000
6.381367    1.001000
6.715033    .333666
7.716033    1.001000
8.717033    1.001000
9.718033    1.001000
10.719033   1.001000
11.720033   1.001000
12.721033   1.001000
13.722033   1.001000
14.014000   .291967
15.015000   1.001000
The output of that script can be redirected to a file, then used with the following gnuplot script to create the graph seen above.
set term png size 800,300
set output "plot.png"
set xlabel "frame #"
set xrange [-10:*]
set ylabel "gap (s)"
set offsets 0, 0, 5, 0
set style line 1 lc rgb '#0060aa' lt 1 lw 2 pt 7 ps 1.5   # --- blue
set style fill solid
set autoscale xfix
set boxwidth 0.1
plot 'plot.dat' with boxes ls 1
Putting that all together, the following will output plot.png for you to view.
$ ./iframegaps.sh video.ts > plot.dat; gnuplot gapplot.script
Hi
I’m trying to trace your BASH, SED and AWK commands using Windows findstr to replicate your plot.dat formation, so far miserably unsuccessfully :\
Could you please share your final plot.dat document?
Thank you,
Oren
I’ve updated the original post with example output that makes up plot.dat, hope that helps.